09 January 2020
Back to the end of 2019, when I was traveling back to China, I saw an adorable and interesting problem on my Moments (a social network on WeChat). The problem is described in the picture below:
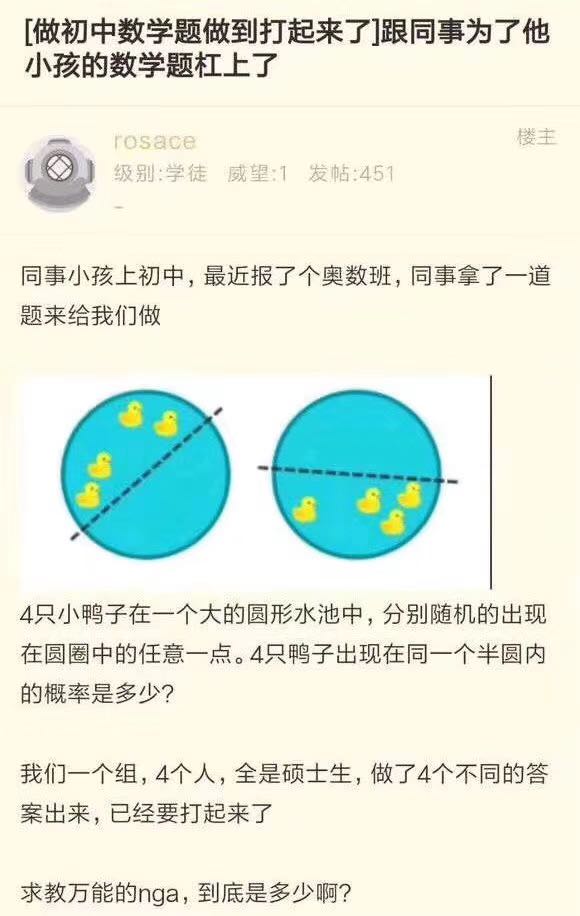
The basic description of this problem is this:
Suppose I have four ducks randomly located inside a round pool, what is the probability that the four ducks happen to be in the same semi-circle?
The first time I see this question, my instant intuition is to simulate it using the Monte-Carlo simulation. And the results for the simulation does converge to the actual probability. I’ll show you how I achieve this using the code below.
First, we’ll make some import statements. The libraries we’re using are pretty simple and common; they are random, math and numpy. The package tqdm is mainly used for providing a progress bar when performing the monte-carlo simulations.
from random import random, uniform
from tqdm import tqdm
from math import sqrt
import numpy as np
The intuition I have is to directly randomly generate 4 points (ducks) inside the circle (pool) for a large number of iterations and to see the probability or ratio between the groups that are in the same semi-circle and the total number of groups I sampled. Following the intuition, we need some functions to determine multiple conditions:
After solving the above requirements/conditions, we’re good to simulate.
inside_circle” for Condition 01.The function inside_circle basically takes the input of the coordinates of both randomly assigned points, the center of the circle (pool) as well as its radius, and returns the decision.
The algorithm is relatively simple, as it only computes the distance of both centers using the distance formula and compares it to the radius. If the distance is greater than the radius, we conclude the simulated point is outside of the pool (returns false) and vice-versa (returns true).
Distance Formula:
\[d = \sqrt{(x_1 - x_2)^2 + (y_1-y_2)^2}\]def inside_circle(center_coord, curr_coord, radius):
return sqrt((curr_coord[0]-center_coord[0])**2 + (curr_coord[1]-center_coord[1])**2) < radius
semicircle” for Condition 02.The function semicircle serves the purpose of determining if four points are in the same semi-circle or not. As this is the core function for the Monte-Carlo simulation, it’s a bit more complicated compared to other functions.
The general idea for this algorithm is that we first connect one point to the circle so that we draw a line that goes through the center, thus created a semi-circle inside the pool. And next, we calculate the function of that line as well as the sign of the rest of points respect to the line. If the signs are consistent, means all positive or all negative, we conclude that the four ducks are in the same semi-circle. And if the signs are not consistent, we draw a line between the next point and the center, until all points are used.
def semicircle(center_coord, curr_row):
    """
    @param center_coord:    The coordinate of pool's center, represented as a tuple.
    @param curr_row:        The coordinate of four simulated ducks (points), represented as a list of tuples.
    @returns:               True if four points are in the same semi-circle, false if not.
    """
    # Calculate the line function for each coord and center.
    # Ax + By + C = 0: A=y2-y1, B=x1-x2, C=x2*y1-x1*y2. 2: center, 1: current point
    result_list = []
    for i in range(4):
        A = center_coord[1]-curr_row[i][1]
        B = curr_row[i][0]-center_coord[0]
        C = center_coord[0]*curr_row[i][1]-curr_row[i][0]*center_coord[1]
        semicircle_result = [A*curr_row[j][0]+B*curr_row[j][1]+C >= 0 for j in range(4) if j != i]
        if len(set(semicircle_result)) == 1:
            return True
    return False
Since the inputs and loops for this function are fixed (4 for the for loop and 4 for the semi-circle list comprehension), the time complexity is $O(n)$
After we prepared all the related functions above, we’re finally able to start the simulation. The ideas are simple; we randomly throw four ducks (points) into the assigned canvas (pool) for a large number of iterations.
In each iteration, we first determine if the randomly assigned points are in the circle or not using the inside_circle() function. If the points are not located inside the circle, we discard the current iteration start a new one.
Once the four points are in the same circle, we then use the semicicle() function to determine if these points are in the same semi-circle or not. If true, both of the success count and the number of trails would increase by one. Otherwise, only the number of trails would increase by one to keep the number of simulations on record.
After running all of the valid iterations, we’ll return the result of simulated probability by calculating the ratio between success_count and number of trails.
\[\text{Simulated Probability} = \frac{\text{Number of Success}}{\text{Total Number of Trials}}\]def main(canvas_size, sim_size):
canvas_radius = float(canvas_size / 2)
center_coord = (canvas_radius, canvas_radius)
curr_sim_size = 0
curr_success_size = 0
curr_sim_matx = np.empty((sim_size + 1, 5))
total_sim_count = 0
step_average = []
pbar = tqdm(total=sim_size)
while curr_sim_size <= sim_size:
total_sim_count += 1
temp_row = [(uniform(0, canvas_size), uniform(0, canvas_size)) for i in range(4)]
temp_row_truth = [inside_circle(center_coord, temp_coord, canvas_radius) for temp_coord in temp_row]
if temp_row_truth != [1, 1, 1, 1]: # Make sure the sampled result is within the circle.
continue
else:
result_semicircle = semicircle(center_coord, temp_row)
if result_semicircle:
curr_success_size += 1
curr_sim_matx[curr_sim_size] = temp_row.append(result_semicircle)
curr_sim_size += 1
step_average.append(curr_success_size / curr_sim_size)
pbar.update(1)
pbar.close()
return float(curr_success_size / sim_size), step_average
def step_avg_plot(step_avg_list, output_path=None):
fig, ax = plt.subplots(figsize=(8, 5))
ax.plot(range(len(step_avg_list)), step_avg_list)
ax.set(xlabel='# Iteration', ylabel='Probability',
title='Monte Carlo Simulation for Approximating the Ducks in Pool Problem')
ax.grid()
if __name__ == "__main__":
    estimated_prob, step_average = main(500, 8000)
    print(estimated_prob)
    step_avg_plot(step_average)
After running 8000 iterations, we get the result of the approximated probability of 0.5005.
We can also keep track of the step-wise probability in each iteration and plot the result using the above step_avg_plot() function.
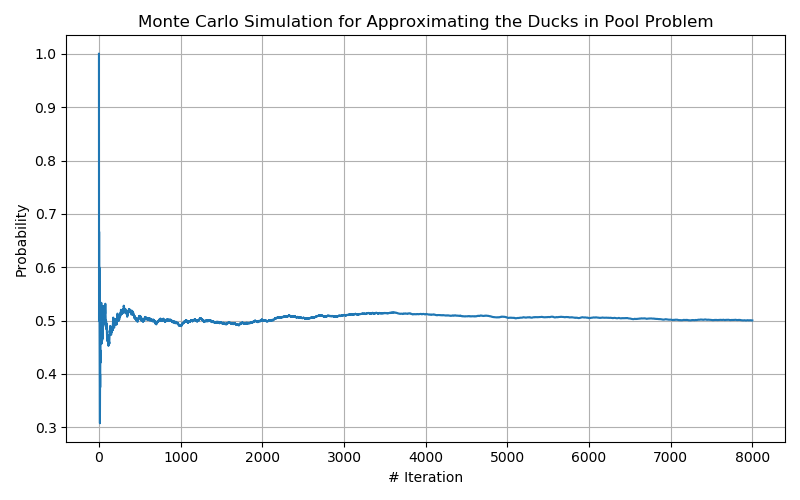
The figure above illustrates the convergence probability in the Monte-Carlo simulation, where the x-axis is the number of iterations and the y-axis being the probability at the relative steps. We observe that the convergence is unstable due to the small size of simulations for the first 1000 iterations. However, the simulation quickly converges to probability 0.5 after 5000 iterations, which is the real-solution proofed by theoretical calculations.